How to use the “Inspect Network of Chrome DevTools”?

Hi, when we are working with web applications is important to know that we can use the Network activity tap to inspect if our request are ok or not for example.
So, In this example I’m going to use this GraphQL environment to show you how to use the Network tab of Chrome DevTools:
Link: https://lucasconstantino.github.io/graphiql-online/
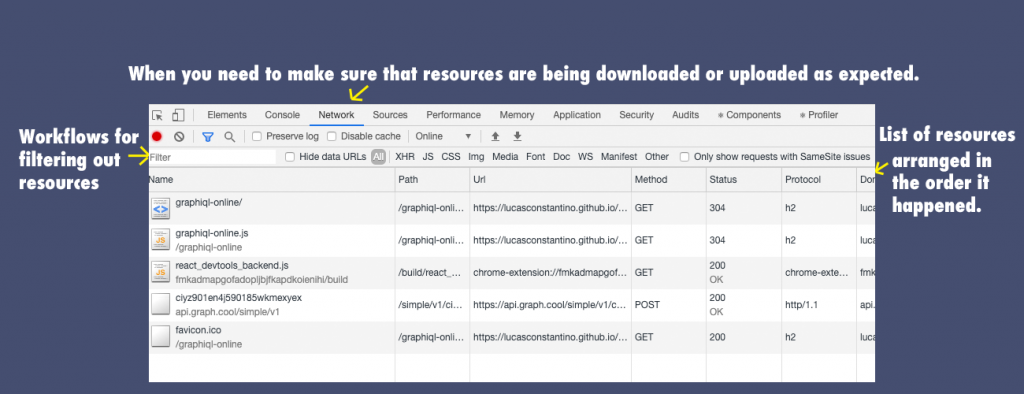
If we open the link and you have to right click on the page, then click on “inspect” then we will see a sticky window.
Here some information in about some features of the window:
We can see more information about each resources doing Right-click the header of the Network Log table and select which info you want to see in the table:
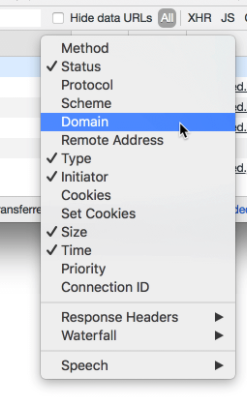
Example:
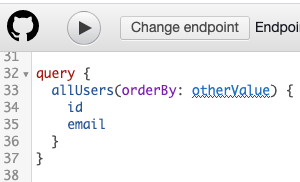
Now we are going to analyze a GraphQL query petition (queries are analogous to REST’s GET and they allow to ask the server for the data we need) In our Network tab.
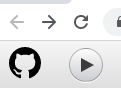
Now click on this button:
Then check this yellow arrows for the next steps:
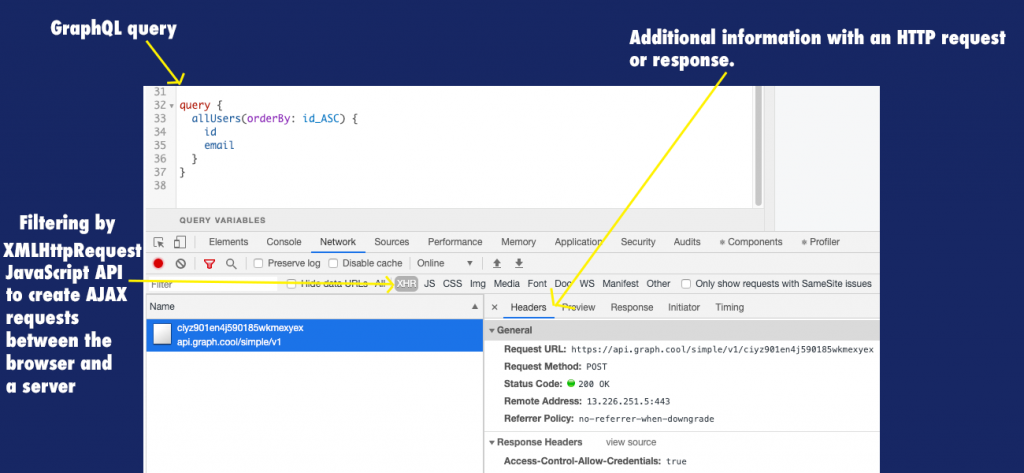
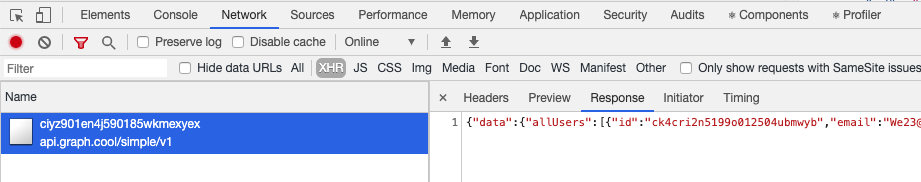
If our request was successful then in our tab Response we will have the server response:
But let suppose that we write the query incorrectly, like inserting other values in the argument of the query and we click on Play:
If we go to the last resource in our Network table (because the resources are ordered chronological) then response tab we will see some explanation about what is causing that we don’t have data as server response:
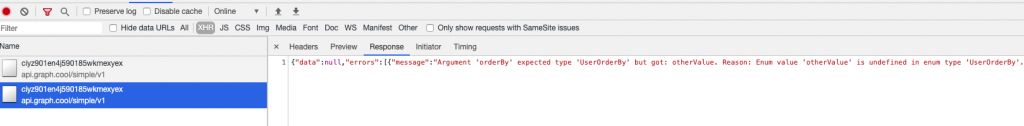
Here we can detect the error and we can fix it.
So, now as you see the network tab is important when we need to make sure that resources are being downloaded or uploaded as expected.
If you want to know more about this network tab, you can read this post.
By Cristina Rojas.